前面几篇文章介绍了SpringBoot继承Prometheus实现埋点上报,基本上可以非常简单的实现采样收集,对于由SpringBoot搭建的web应用,甚至是可以说是引入依赖,简单的配置下,剩下的啥也不用管,就可以配置一个REST应用的监控大盘
接下来我们通过AOP的方式,来定义一个自定义数据采集的功能,用于实现一些上面覆盖不到的场景(如应用内的定时任务执行情况,三方接口请求监控等)
I. 方案确定与环境搭建
1.metric选择
通过前面的几篇文章,至少我们会了解到Prometheus的四种Metric,对于自定义的数据采集,根据最终希望监控的指标(每秒请求数 qps, 响应耗时 rt, 可用率 sla, 请求分布),我们这里选择Histogram
- 通过histogram指标中的 count 值来计算qps
- 通过 sum / count 来计算rt
- 通过
成功数 / 总请求数计算可用率sla
- 通过histogram的bucket分布来查看请求分布
2.项目依赖
本项目借助SpringBoot 2.2.1.RELEASE + maven 3.5.3 + IDEA进行开发
其核心pom依赖,主要是下面几个包
1
2
3
4
5
6
7
8
9
10
11
12
13
14
15
16
17
18
19
20
21
22
23
24
25
26
| <dependencies>
<dependency>
<groupId>org.springframework.boot</groupId>
<artifactId>spring-boot-starter-actuator</artifactId>
</dependency>
<dependency>
<groupId>org.springframework.boot</groupId>
<artifactId>spring-boot-starter-web</artifactId>
</dependency>
<dependency>
<groupId>io.micrometer</groupId>
<artifactId>micrometer-registry-prometheus</artifactId>
</dependency>
<dependency>
<groupId>org.springframework.boot</groupId>
<artifactId>spring-boot-starter-aop</artifactId>
</dependency>
<dependency>
<groupId>org.springframework</groupId>
<artifactId>spring-aop</artifactId>
<version>5.2.1.RELEASE</version>
<scope>compile</scope>
</dependency>
</dependencies>
|
3. 配置信息
其次是配置文件,注册下Prometheus的相关信息
1
2
3
4
5
6
7
8
9
10
11
| spring:
application:
name: spring-prometheus-metric
management:
endpoints:
web:
exposure:
include: "*"
metrics:
tags:
application: ${spring.application.name}
|
上面配置中,有两个关键信息,前面博文也有介绍,这里简单说明
management.endpoints.web.exposure.include 这里指定所有的web接口都会上报metrics.tags.application 这个应用所有上报的metrics 都会带上application这个标签
配置完毕之后,会提供一个 /actuator/prometheus的端点,供prometheus来拉取Metrics信息
II. AOP切面实现埋点上报
1. 切面实现类
通过切面来拦截目标类的执行,选择三个关键指标
- service: 表示具体执行的类
- method:执行的方法
- err: true 表示执行异常/else 表示执行正常
直接使用Histogram来实现数据采集上报,直接使用前面博文* 【中间件】Prometheus自定义埋点姿势二 | 一灰灰Blog 使用姿势即可
1
2
3
4
5
6
7
8
9
10
11
12
13
14
15
16
17
18
19
20
21
22
23
24
25
26
27
28
29
30
31
32
33
34
35
36
37
38
39
40
| @Aspect
@Component
public class MetricAop {
@Autowired
private MeterRegistry meterRegistry;
@Pointcut("execution(public * com.git.hui.demo.prometheus.service.*.*(..))")
public void point() {
}
@Around("point()")
public Object execute(ProceedingJoinPoint joinPoint) throws Throwable {
String service = joinPoint.getTarget().getClass().getSimpleName();
String method = joinPoint.getSignature().getName();
Timer.Sample sample = Timer.start();
boolean hasError = false;
try {
return joinPoint.proceed();
} catch (Throwable e) {
hasError = true;
throw e;
} finally {
Timer timer = Timer.builder("micro_service_histogram")
.minimumExpectedValue(Duration.ofMillis(1))
.maximumExpectedValue(Duration.ofMinutes(3))
.sla(Duration.ofMillis(10), Duration.ofMillis(50), Duration.ofMillis(100), Duration.ofMillis(300), Duration.ofMillis(1000))
.tags(Tags.of("service", service, "method", method, "err", String.valueOf(hasError)))
.register(meterRegistry);
sample.stop(timer);
}
}
}
|
2. 测试方法
这里写两个简单的Service类,作为收集采样的目标
1
2
3
4
5
6
7
8
9
10
11
12
13
14
15
16
17
18
19
20
21
22
23
24
25
26
27
28
29
30
31
32
33
34
35
36
37
38
39
40
41
42
43
44
45
46
47
48
49
50
51
52
| @Service
public class DemoService {
private Random random = new Random();
private void trySleep() {
try {
Thread.sleep(random.nextInt(50));
} catch (InterruptedException e) {
e.printStackTrace();
}
}
public int add(int a, int b) {
trySleep();
return a + b;
}
public int sub(int a, int b) {
trySleep();
return a - b;
}
public int divide(int a, int b) {
trySleep();
return a / b;
}
}
@Service
public class HelloService {
private Random random = new Random();
private void trySleep() {
try {
Thread.sleep(random.nextInt(100) + 100);
} catch (InterruptedException e) {
e.printStackTrace();
}
}
public String hello(String name) {
trySleep();
return "hello: " + name;
}
public String welcome(String name) {
trySleep();
return "welcome: " + name;
}
}
|
然后我们通过定时任务来不断的访问上面的服务方法,用来模拟请求场景
1
2
3
4
5
6
7
8
9
10
11
12
13
14
15
16
17
18
19
20
21
22
23
24
25
26
27
28
29
30
31
32
33
34
35
36
| @Autowired
private DemoService demoService;
@Autowired
private HelloService helloService;
private Random random = new Random();
private void call(Runnable runnable, CountDownLatch latch) {
new Thread(() -> {
try {
runnable.run();
} finally {
latch.countDown();
}
}).start();
}
@Async("main")
@Scheduled(fixedDelay = 100)
public void doDemoCall() {
CountDownLatch latch = new CountDownLatch(3);
call(() -> demoService.add(random.nextInt(10), random.nextInt(30)), latch);
call(() -> demoService.sub(random.nextInt(10), random.nextInt(30)), latch);
call(() -> demoService.divide(random.nextInt(10), random.nextInt(30)), latch);
latch.countDown();
}
@Async
@Scheduled(fixedDelay = 100)
public void doHelloCall() {
CountDownLatch latch = new CountDownLatch(2);
call(() -> helloService.hello("YiHui " + random.nextInt(30)), latch);
call(() -> helloService.welcome("YiHui " + random.nextInt(30)), latch);
latch.countDown();
}
|
3. 启动类
最后就是在启动类中注册一下MeterRegistryCustomizer,为所有的metric携带上application标签
1
2
3
4
5
6
7
8
9
10
11
12
13
14
15
16
| @EnableScheduling
@SpringBootApplication
public class Application {
public static void main(String[] args) {
SpringApplication.run(Application.class);
}
@Bean
MeterRegistryCustomizer<MeterRegistry> configurer(@Value("${spring.application.name}") String applicationName) {
return (registry) -> {
registry.config().commonTags("application", applicationName);
MetricWrapper.setMeterRegistry(registry);
};
}
}
|
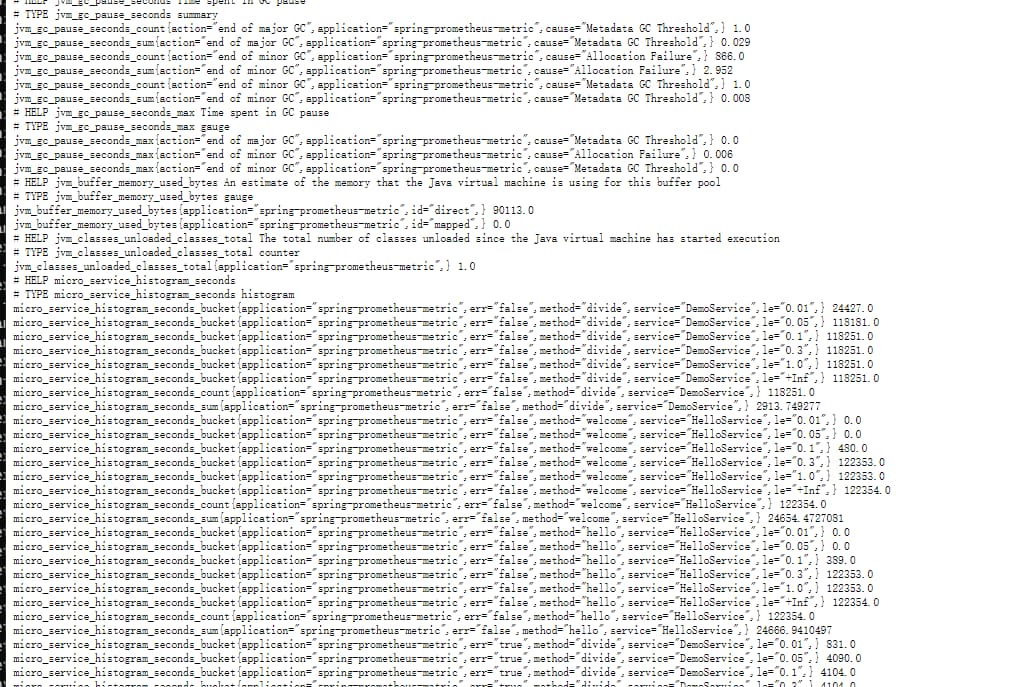
应用启动之后,就可以通过http://m-162d9nnes031u:8080/actuator/prometheus来查看收集的采样信息了,如
4. 业务大盘配置
上面基本即实现了一个基于aop的采样收集,接下来重点就是如何将这些收集上来的数据,可视化配置起来
借助Grafana无疑是个比较推荐的case,下一篇博文将详细介绍如何针对上面收集的信息进行友好的配置,欢迎有兴趣的小伙伴关注吐槽
III. 不能错过的源码和相关知识点
0. 项目源码
系列博文:
1. 微信公众号: 一灰灰Blog
尽信书则不如,以上内容,纯属一家之言,因个人能力有限,难免有疏漏和错误之处,如发现bug或者有更好的建议,欢迎批评指正,不吝感激
下面一灰灰的个人博客,记录所有学习和工作中的博文,欢迎大家前去逛逛

打赏
如果觉得我的文章对您有帮助,请随意打赏。

微信打赏

支付宝打赏