之前介绍了一篇SpringBoot集成Prometheus实现数据上报的博文,在前面一篇博文中,更多的是一个SpringBoot应用如何最小成本的接入Prometheus,并结合Grafana配置一个完整的应用监控大盘
有看过前文的小伙伴可能知晓,SpringBoot接入Prometheus之后,基本上不用做额外的开发,就已经实现了我们关心的JVM情况、GC情况、HTTP调用请求等信息,然而在实际的业务开发过程中,我们总会遇到一些需要手动上报的场景,那么我们可以怎么处理呢?
本文的核心知识点:
- 通过一个实例演示SpringBoot应用,如何实现自定义的数据上报
上篇博文: SpringBoot整合Prometheus实现应用监控
I. 项目环境搭建
本文演示的项目主要为SpringBoot2.2.1版本,更高的版本使用姿势没有太大的区别,至于1.x版本的不确保可行(因为我并没有测试)
1.依赖
pom依赖,主要是下面几个包
1
2
3
4
5
6
7
8
9
10
11
12
13
14
15
16
| <dependencies>
<dependency>
<groupId>org.springframework.boot</groupId>
<artifactId>spring-boot-starter-actuator</artifactId>
</dependency>
<dependency>
<groupId>org.springframework.boot</groupId>
<artifactId>spring-boot-starter-web</artifactId>
</dependency>
<dependency>
<groupId>io.micrometer</groupId>
<artifactId>micrometer-registry-prometheus</artifactId>
</dependency>
</dependencies>
|
2. 配置信息
其次是配置文件,注册下Prometheus的相关信息
1
2
3
4
5
6
7
8
9
10
11
| spring:
application:
name: prometheus-example
management:
endpoints:
web:
exposure:
include: "*"
metrics:
tags:
application: ${spring.application.name}
|
上面配置中,有两个关键信息,前面博文也有介绍,这里简单说明
management.endpoints.web.exposure.include 这里指定所有的web接口都会上报metrics.tags.application 这个应用所有上报的metrics 都会带上application这个标签
配置完毕之后,会提供一个 /actuator/prometheus的端点,供prometheus来拉取Metrics信息
II. 自定义上报
假设我们现在想自己上报http请求的相关信息,当前计划采集下面几个信息
- 总的请求数:采用
Counter
- 当前正在处理的请求数:采用
Gauge
- 请求耗时直方图:
Histogram
1. Prometheus Metric封装
基于上面的分析,我们这里实现了三种常见的Metric信息上报,这里提供一个统一的封装类,用于获取对应的Metric类型
1
2
3
4
5
6
7
8
9
10
11
12
13
14
15
16
17
18
19
20
21
22
23
24
25
26
27
28
29
30
31
32
33
34
35
36
37
38
39
40
41
42
43
44
45
46
47
48
49
50
51
52
53
54
55
56
57
58
59
60
61
62
63
64
65
66
| package com.git.hui.boot.prometheus.interceptor;
import io.prometheus.client.CollectorRegistry;
import io.prometheus.client.Counter;
import io.prometheus.client.Gauge;
import io.prometheus.client.Histogram;
import org.springframework.beans.BeansException;
import org.springframework.context.ApplicationContext;
import org.springframework.context.ApplicationContextAware;
import org.springframework.stereotype.Component;
@Component
public class PrometheusComponent implements ApplicationContextAware {
private static PrometheusComponent instance;
private Counter reqCounter;
private Gauge duringReqGauge;
private Histogram reqLatencyHistogram;
@Override
public void setApplicationContext(ApplicationContext applicationContext) throws BeansException {
instance = this;
CollectorRegistry collectorRegistry = applicationContext.getBean(CollectorRegistry.class);
reqCounter = Counter.build().name("demo_rest_req_total").labelNames("path", "method", "code")
.help("总的请求计数").register(collectorRegistry);
duringReqGauge = Gauge.build()
.name("demo_rest_inprogress_req").labelNames("path", "method")
.help("正在处理的请求数").register(collectorRegistry);
reqLatencyHistogram = Histogram.build().labelNames("path", "method", "code")
.name("demo_rest_requests_latency_seconds_histogram").help("请求耗时分布")
.register(collectorRegistry);
}
public static PrometheusComponent getInstance() {
return instance;
}
public Counter counter() {
return reqCounter;
}
public Gauge gauge() {
return duringReqGauge;
}
public Histogram histogram() {
return reqLatencyHistogram;
}
}
|
注意上面的setApplicationContext()的方法实现逻辑,其中在创建Counter/Gauge/Histogram时,使用的是simpleclient包中提供的最基础的用法,并不是micrometer的封装方式,后面一篇博文会介绍到两种的差异性
上面实现的特点在于,创建Metric时,就已经定义好了label标签,这里定义了
- path: 请求url路径
- method: http方法, get/post
- code: 状态码,表示请求成功还是异常
2. 拦截器实现自定义信息采集上报
接下来我们实现一个自定义的拦截器,拦截所有的http请求,然后上报关键信息
1
2
3
4
5
6
7
8
9
10
11
12
13
14
15
16
17
18
19
20
21
22
23
24
25
26
27
28
29
30
31
32
33
34
35
36
37
38
| public class PrometheusInterceptor extends HandlerInterceptorAdapter {
private ThreadLocal<Histogram.Timer> timerThreadLocal = new ThreadLocal<>();
@Override
public boolean preHandle(HttpServletRequest request, HttpServletResponse response, Object handler) throws Exception {
PrometheusComponent.getInstance().gauge().labels(request.getRequestURI(), request.getMethod()).inc();
timerThreadLocal.set(PrometheusComponent.getInstance().histogram()
.labels(request.getRequestURI(), request.getMethod(), String.valueOf(response.getStatus()))
.startTimer());
return super.preHandle(request, response, handler);
}
@Override
public void afterCompletion(HttpServletRequest request, HttpServletResponse response, Object handler, Exception ex) throws Exception {
String uri = request.getRequestURI();
String method = request.getMethod();
int status = response.getStatus();
PrometheusComponent.getInstance().counter().labels(uri, method, String.valueOf(status)).inc();
PrometheusComponent.getInstance().gauge().labels(uri, method).dec();
Histogram.Timer timer = timerThreadLocal.get();
if (timer != null) {
timer.observeDuration();
timerThreadLocal.remove();
}
super.afterCompletion(request, response, handler, ex);
}
}
|
对于拦截器的知识点这里不进行展开,有兴趣的小伙伴可以查看 SpringBoot系列Web篇之拦截器Interceptor使用姿势介绍
这里我们主要关心的就两点
- 执行之前(
preHandle): gauge计数+1,开始计时
- 执行之后 (
afterCompletion): guage计数-1,counter计数+1,计时收集
3. 测试
最后我们需要注册上面的拦截器,并写个demo进行测试一下
1
2
3
4
5
6
7
8
9
10
11
12
13
14
15
16
17
18
19
20
21
22
23
24
25
26
27
28
29
30
31
| @RestController
@SpringBootApplication
public class Application implements WebMvcConfigurer {
private Random random = new Random();
@Override
public void addInterceptors(InterceptorRegistry registry) {
registry.addInterceptor(new PrometheusInterceptor()).addPathPatterns("/**");
}
@GetMapping(path = "hello")
public String hello(String name) {
int sleep = random.nextInt(200);
try {
Thread.sleep(sleep);
} catch (InterruptedException e) {
e.printStackTrace();
}
return "hello sleep: " + sleep + " for " + name;
}
public static void main(String[] args) {
SpringApplication.run(Application.class);
}
@Bean
MeterRegistryCustomizer<MeterRegistry> configurer(@Value("${spring.application.name}") String applicationName) {
return (registry) -> registry.config().commonTags("application", applicationName);
}
}
|
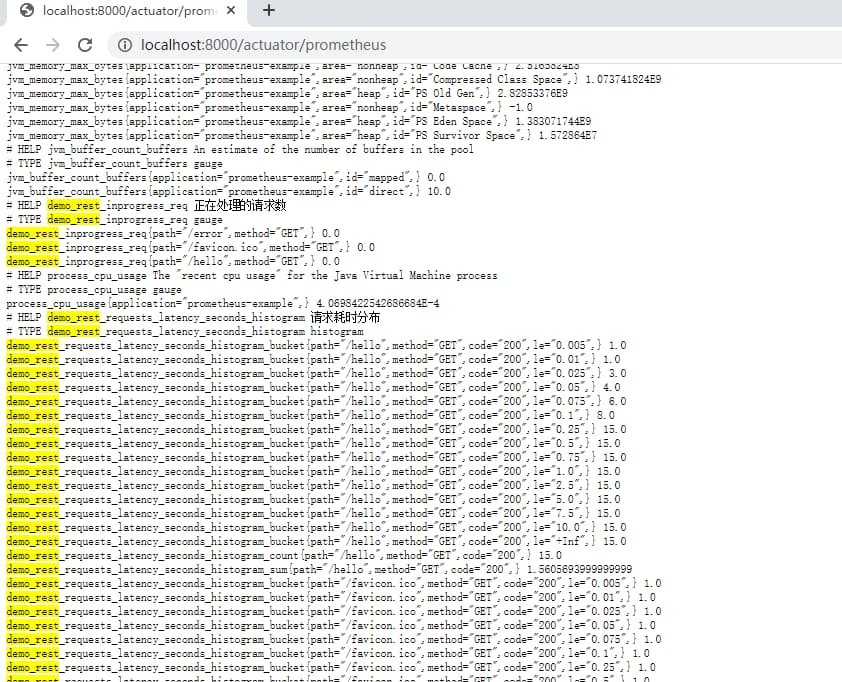
应用启动之后,访问几次hello的http接口,然后在查看一下metric信息,看是否有我们刚才上报的数据
4. 小结
这一篇博文算是上一篇的补全,若我们希望自定义上报一些信息,可以使用上面这种方式来支持
当然,上报并不代表结束,接下来配置大盘等信息也非常的关键,特别是直方图如何配置Grafana?怎么查看请求的耗时分布情况,就由下文来介绍了
III. 不能错过的源码和相关知识点
0. 项目
1. 微信公众号: 一灰灰Blog
尽信书则不如,以上内容,纯属一家之言,因个人能力有限,难免有疏漏和错误之处,如发现bug或者有更好的建议,欢迎批评指正,不吝感激
下面一灰灰的个人博客,记录所有学习和工作中的博文,欢迎大家前去逛逛

打赏
如果觉得我的文章对您有帮助,请随意打赏。

微信打赏

支付宝打赏