1. prometheus 安装
教程文档: https://www.prometheus.wang/quickstart/install-prometheus-server.html
1.1 什么是Prometheus
普罗米修斯:Prometheus是一个开放性的监控解决方案,用户可以非常方便的安装和使用Prometheus并且能够非常方便的对其进行扩展
下面将实现一个SpringBoot应用接入Prometheus的全过程
1.2 安装
Linux 安装
- 官网指定下载包: https://prometheus.io/download/
下载本地安装启动
1 | wget https://github.com/prometheus/prometheus/releases/download/v2.26.0/prometheus-2.26.0.linux-amd64.tar.gz |
启动完毕之后,本地访问 http://127.0.0.1:9090/graph 可以看到默认提供的界面
2. SpringBoot应用接入
我们演示的SpringBoot为2.0+,因此直接选择io.micrometer 的依赖包来实现;更低版本的不能使用这种姿势,可以直接使用官方提供的client来实现;这里不进行扩展
2.1 依赖配置
借助SpringBoot的actuator来提供扩展端点(所以本文采用的是Prometheus的拉工作模式)
SpringBoot版本为 2.2.1.RELEASE
核心依赖
1 | <dependencies> |
yaml配置文件,需要指定Prometheus相关的参数,一个demo如下
1 | spring: |
注意
management.endpoints.web.exposure.include这里指定所有的web接口都会上报metrics.tags.application这个应用所有上报的metrics 都会带上application这个标签
上面配置完毕之后,会提供一个 /actuator/prometheus的端点,供prometheus来拉取Metrics信息
2.2 应用启动
对于SpringBoot而言,此时就不需要额外做什么,就可以实现应用的基本信息上报了
一个简单的demo如下
1 |
|
到此,springboot应用的监控就算是完成了;接下来配置一下prometheus的服务端
3. prometheus 配置与实测
在前面下载的包下面,有一个配置文件 prometheus.yml,新增一个Job
1 | - job_name: 'prometheus-example' |
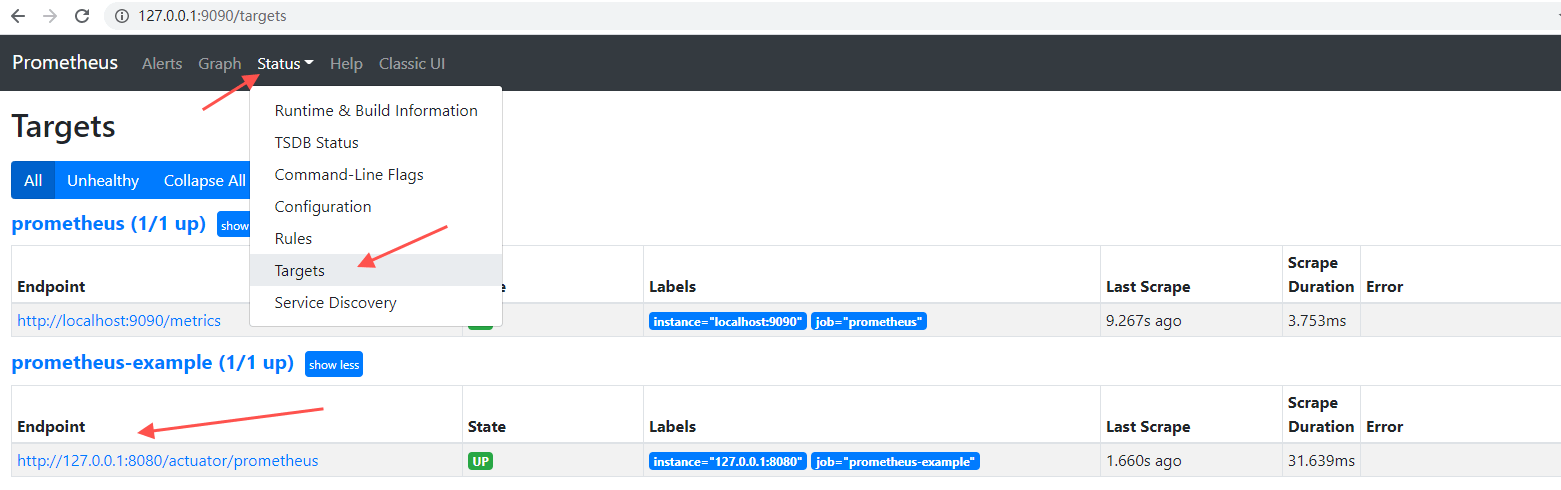
修改配置之后,需要重启一下,当服务启动之后,可以在控制台上我们的应用信息
接下来访问Graph,选择metric: http_server_requests_seconds_count 可以看到一条抓起metric的记录
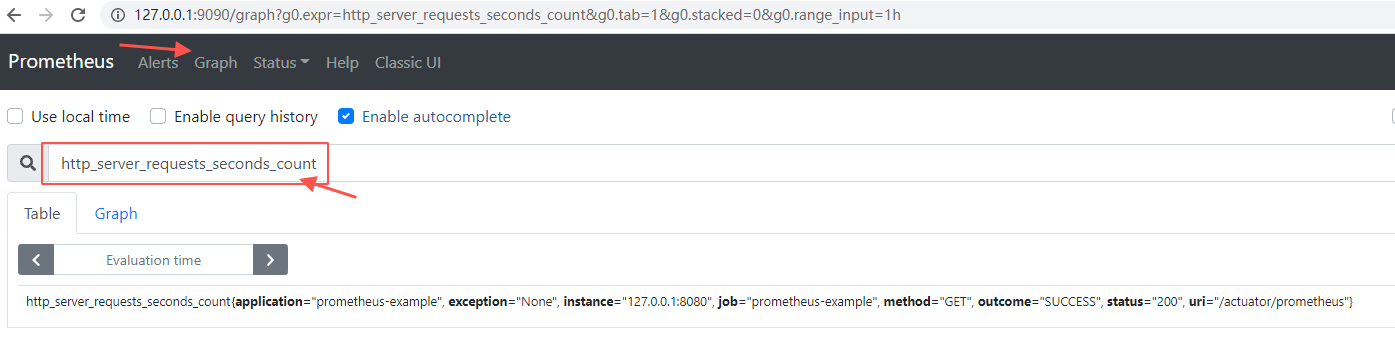
前面我们定义了一个Controller,接下来简单访问几次,然后再看一下,会发现多一条记录
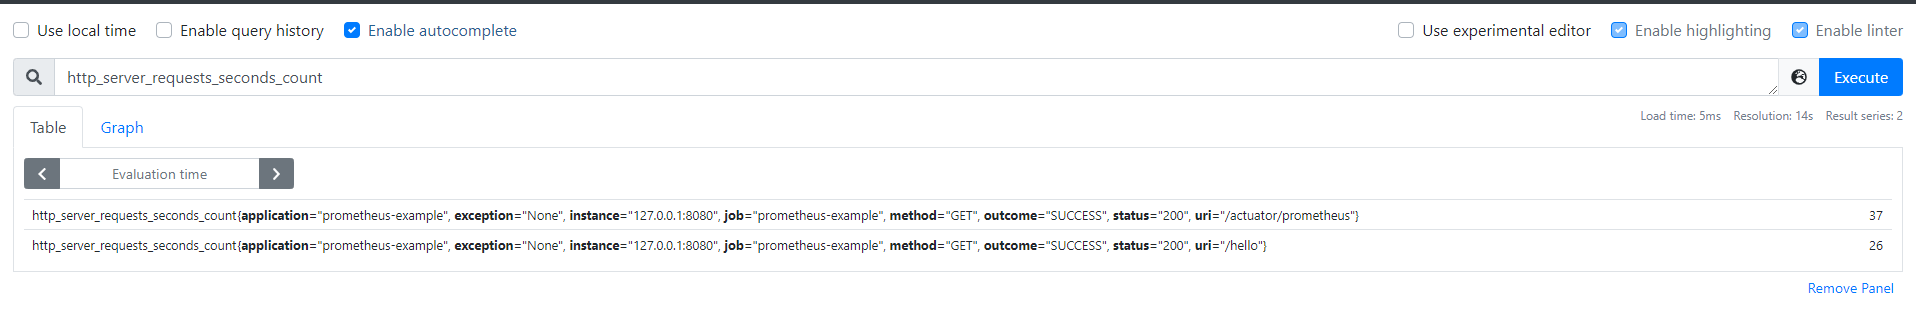
这些数据由框架层直接集成,实现REST接口的相关信息上报,借助这个metric,我们可以实现qps的统计
3.1 qps统计
1 | sum(rate(http_server_requests_seconds_count{application="prometheus-example"}[10s])) |
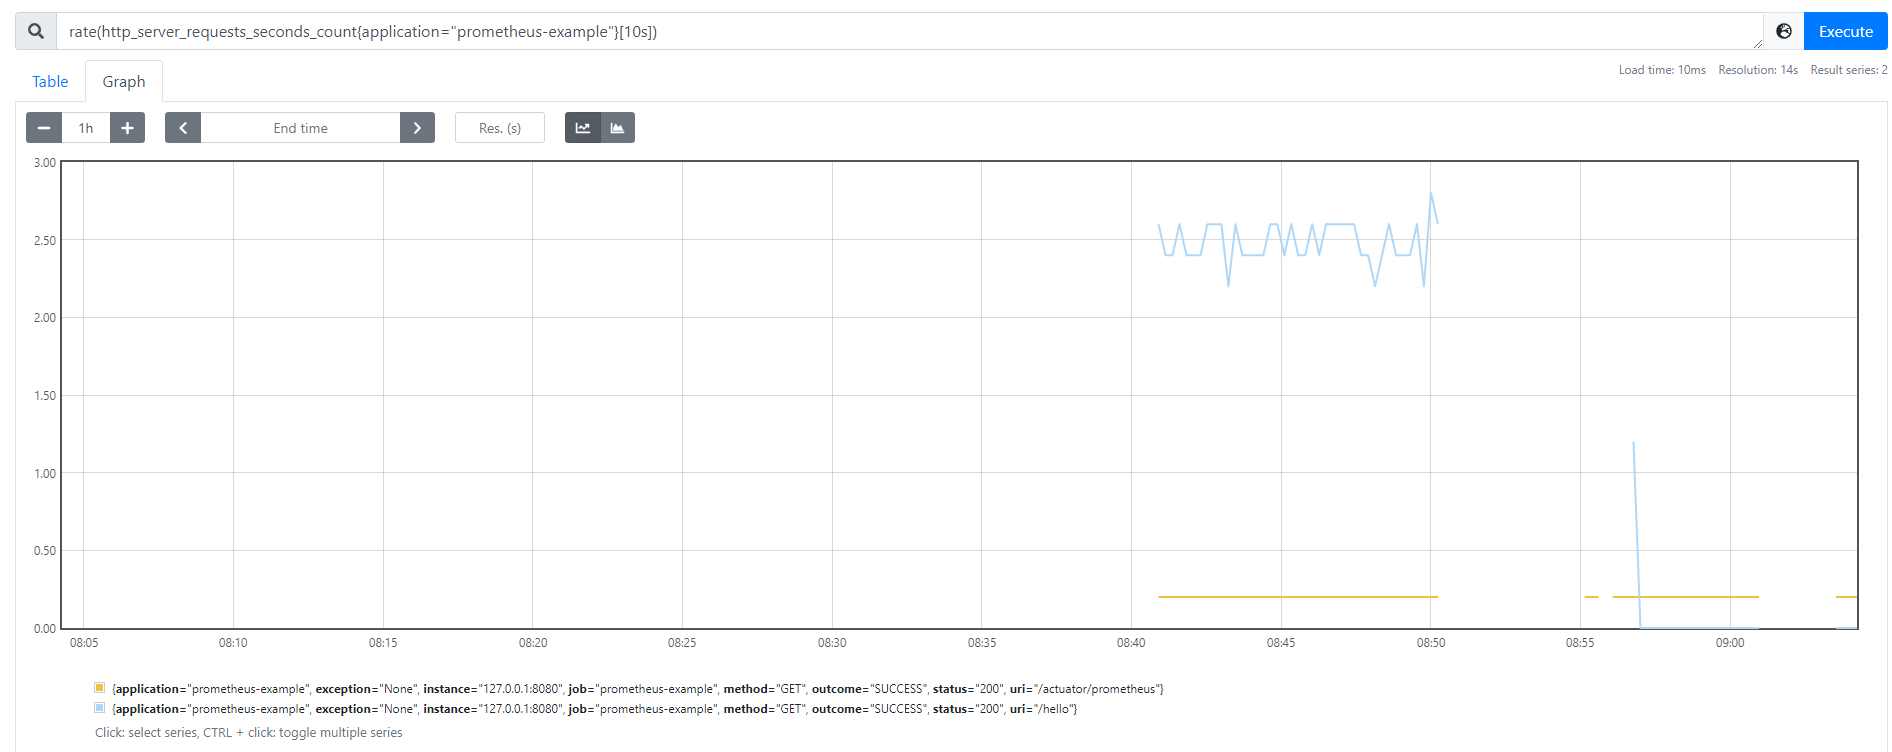
- rate: 用于统计增长趋势,要求上报的Metric为Counter类型(只增不减)
- irate: 与rate相似,区别在于rate统计的是一段时间内的平均增长速率,无法反应这个时间窗口内的突发情况(即瞬时高峰),irate通过区间向量中最后两个样本数据来计算增长速率,但是当选用的区间范围较大时,可能造成不小的偏差
- sum: 求和,适用于统计场景
更多内置函数,可以参考: PromQL内置函数
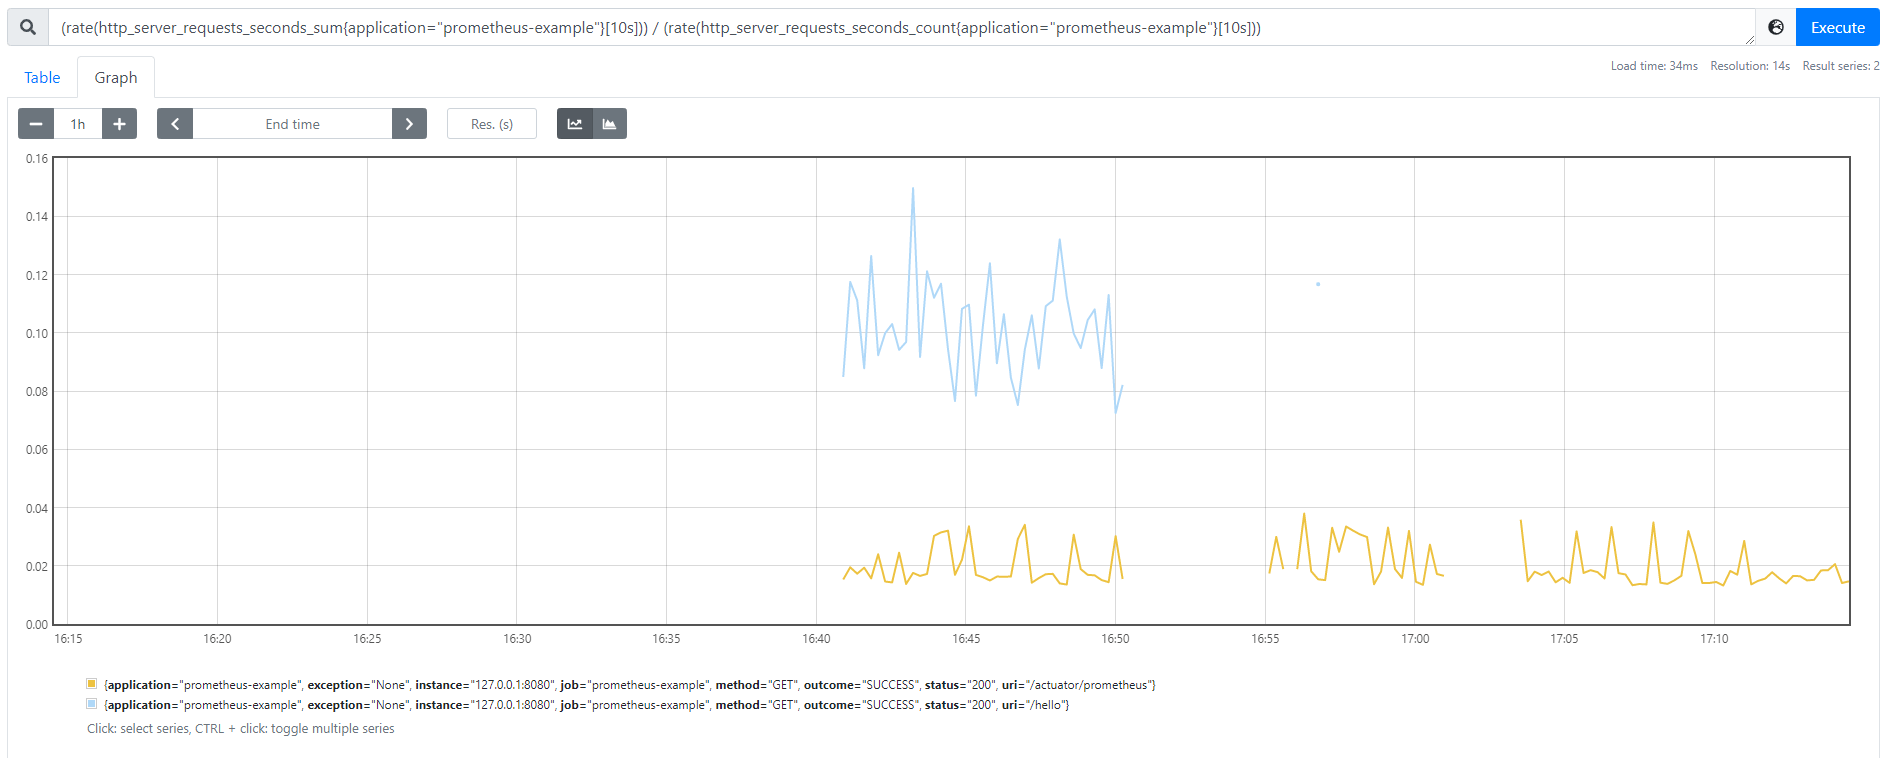
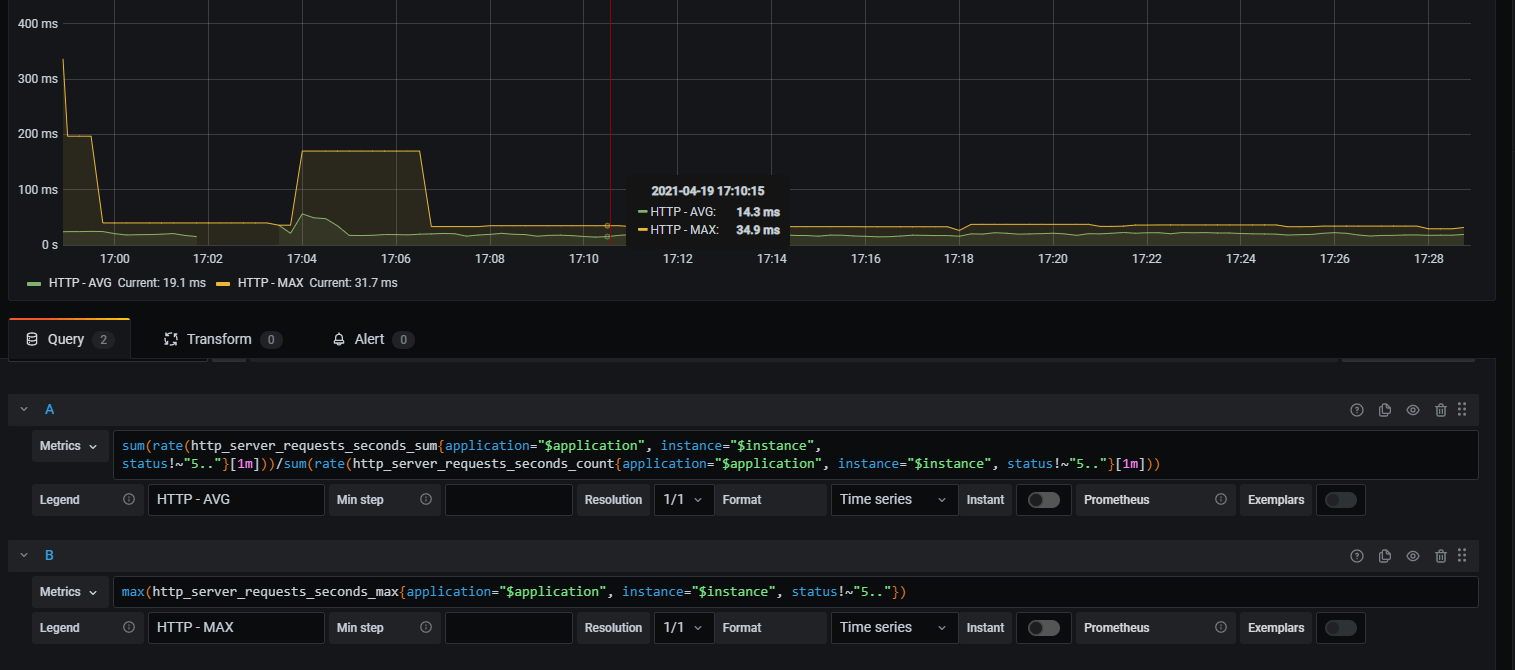
3.2 耗时统计
除了qps,另外一个经常关注的指标就是rt了,如上面接口的平均rt,通过两个Metric的组合来实现
1 | sum(rate(http_server_requests_seconds_sum{application="prometheus-example"}[10s])) / sum(rate(http_server_requests_seconds_count{application="prometheus-example"}[10s])) |
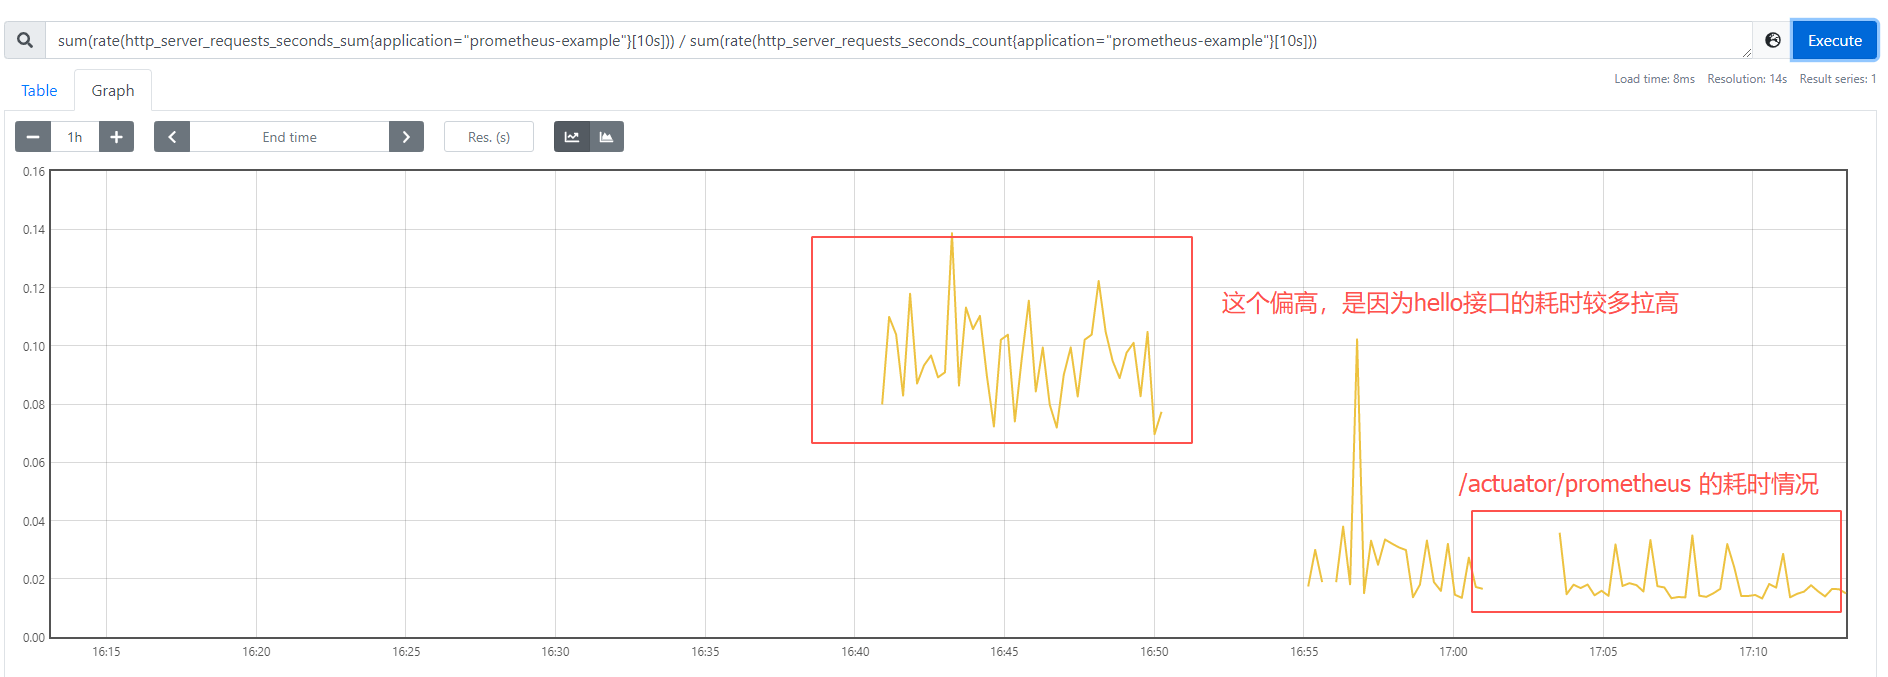
将sum聚合去掉之后,则可以看到各接口的访问情况
4. Grafana 大盘配置
面板监控,还是Grafana的比较强大,特别是grafana本身提供了很多模板可以直接导入
安装可以参考: 210318-linux grafana大盘接入mysql
4.1 大盘配置
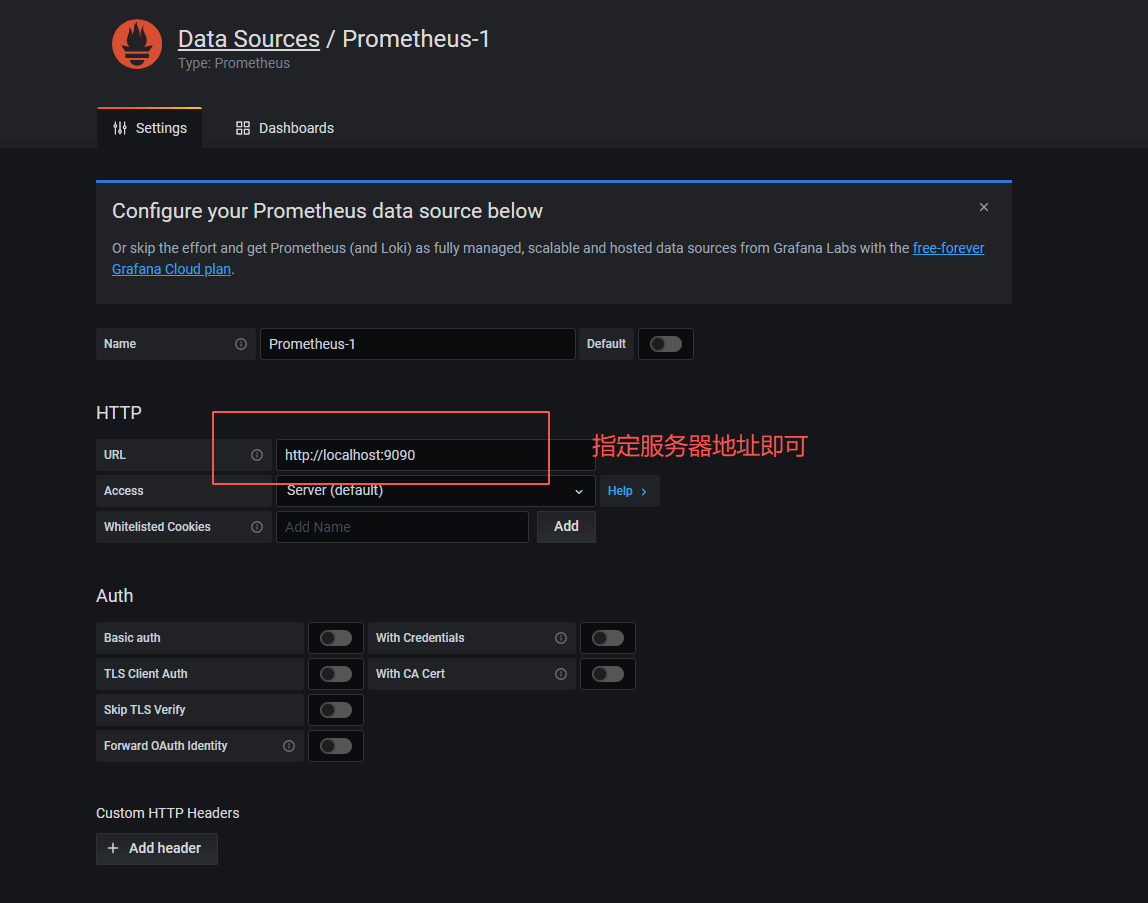
grafana启动之后,配置数据源Promethues
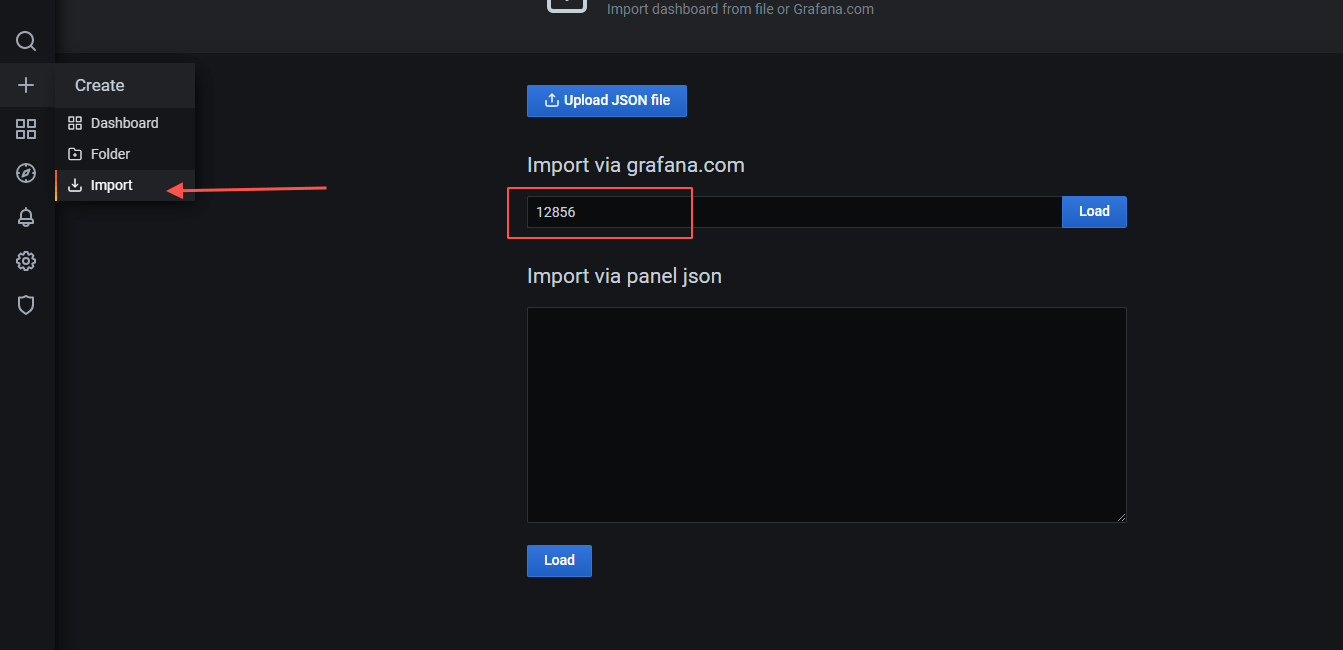
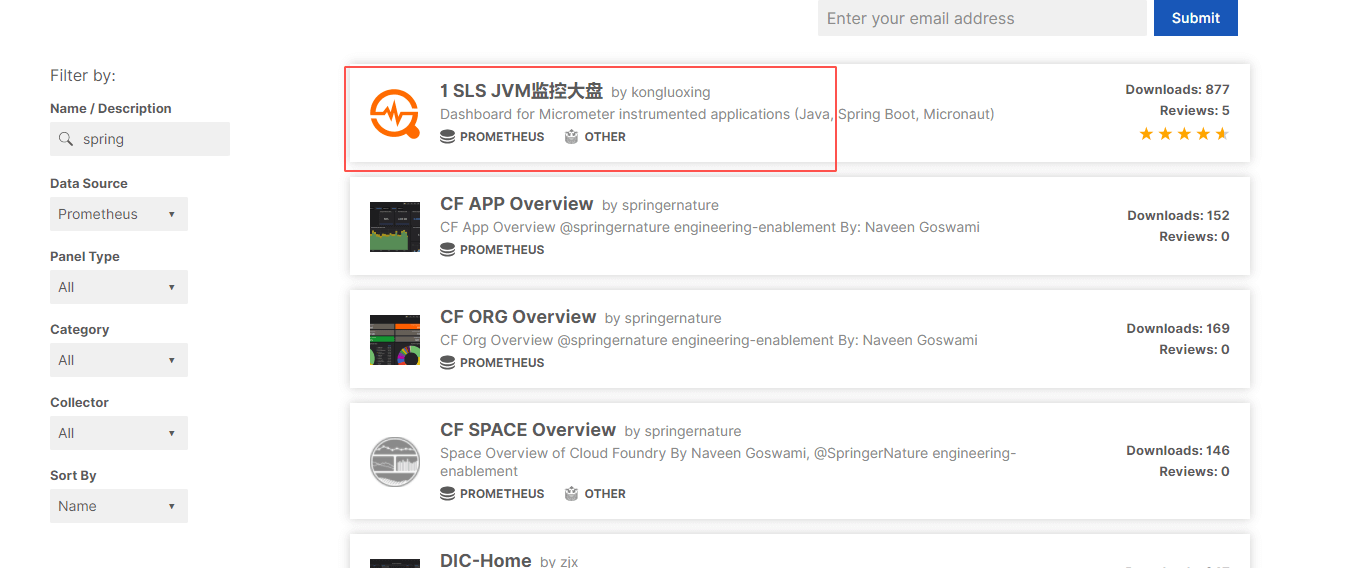
接下来配置SpringBoot的应用配置面板,可以直接使用现成的模板,比如 12856
导入完毕之后,大盘展示如下
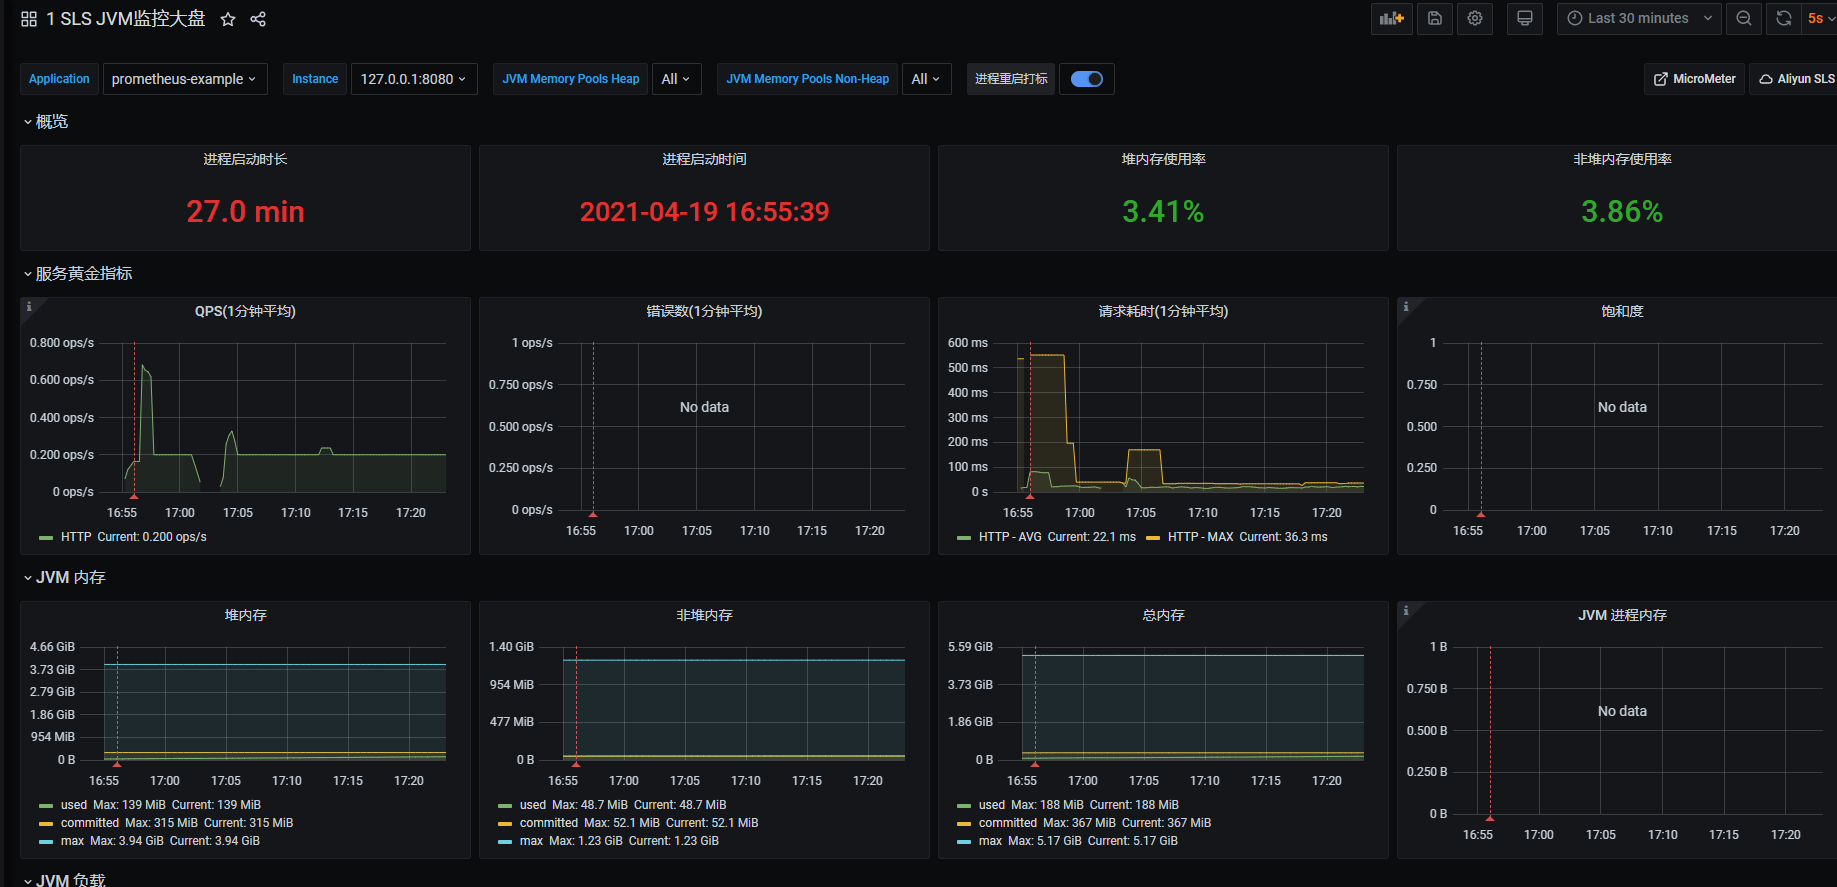
可以看一下请求耗时的统计promql
4.2 大盘模板哪里找
如何找直接可用的大盘呢?
- 官网的大盘上查找即可
- 如 https://grafana.com/grafana/dashboards?dataSource=prometheus&search=spring
- 选择一个,点进去之后,右边的
Copy ID toClipboard对应的数字就是我们需要的
5. 小结
上面整个流程走下来会发现SpringBoot项目接入Prometheus成本很低,基本上没有太多的编码工作,就可以配置给功能集全的监控大盘,简直不要太嗨
高度封装的便捷性再这里体现得非常突出了,但是搞完之后,再回想一下,我get到了什么?
好像什么都没get到,如果我的服务只提供grpc/dubbo接口,现在假设让我们接入监控,好像还是抓瞎,这该怎么玩
II. 其他
0. 项目
- 工程:https://github.com/liuyueyi/spring-boot-demo
- 项目源码: https://github.com/liuyueyi/spring-boot-demo/tree/master/spring-boot/420-prometheus-basic
1. 一灰灰Blog
尽信书则不如,以上内容,纯属一家之言,因个人能力有限,难免有疏漏和错误之处,如发现bug或者有更好的建议,欢迎批评指正,不吝感激
下面一灰灰的个人博客,记录所有学习和工作中的博文,欢迎大家前去逛逛
- 一灰灰Blog个人博客 https://blog.hhui.top
- 一灰灰Blog-Spring专题博客 http://spring.hhui.top